This is a write-up of a weekend project, vitald, I
made after buying a Google Fitbit Air (I’m slowly transitioning
out of the Apple ecosystem).
One of the main reasons I gravitated towards the Fitbit Air was that, with the Google Health App, my health metrics are synchronized to my Google account, which in turn can be pulled offline over API (data ownership!).
This means that I can fetch and synchronize all my health data offline and visualize it to do my own collection and wrangling with the data.
This is what I built vitald to do: it is a
systemd-compatible service that periodically pulls my health data,
stores it into a database, and connects it to Grafana for visualization
and playing around with the data to make better health choices.
Showcase
It’s critical to note that wearable fitness trackers provide estimates of health metrics and should not be seen as 100% accurate data. Do not use commercial wearables as replacements for medical professionals.
The end result from this project is that I created 6 analytics views for Grafana. Below is the primary “overview” dashboard that I use to see my metrics at a glance.
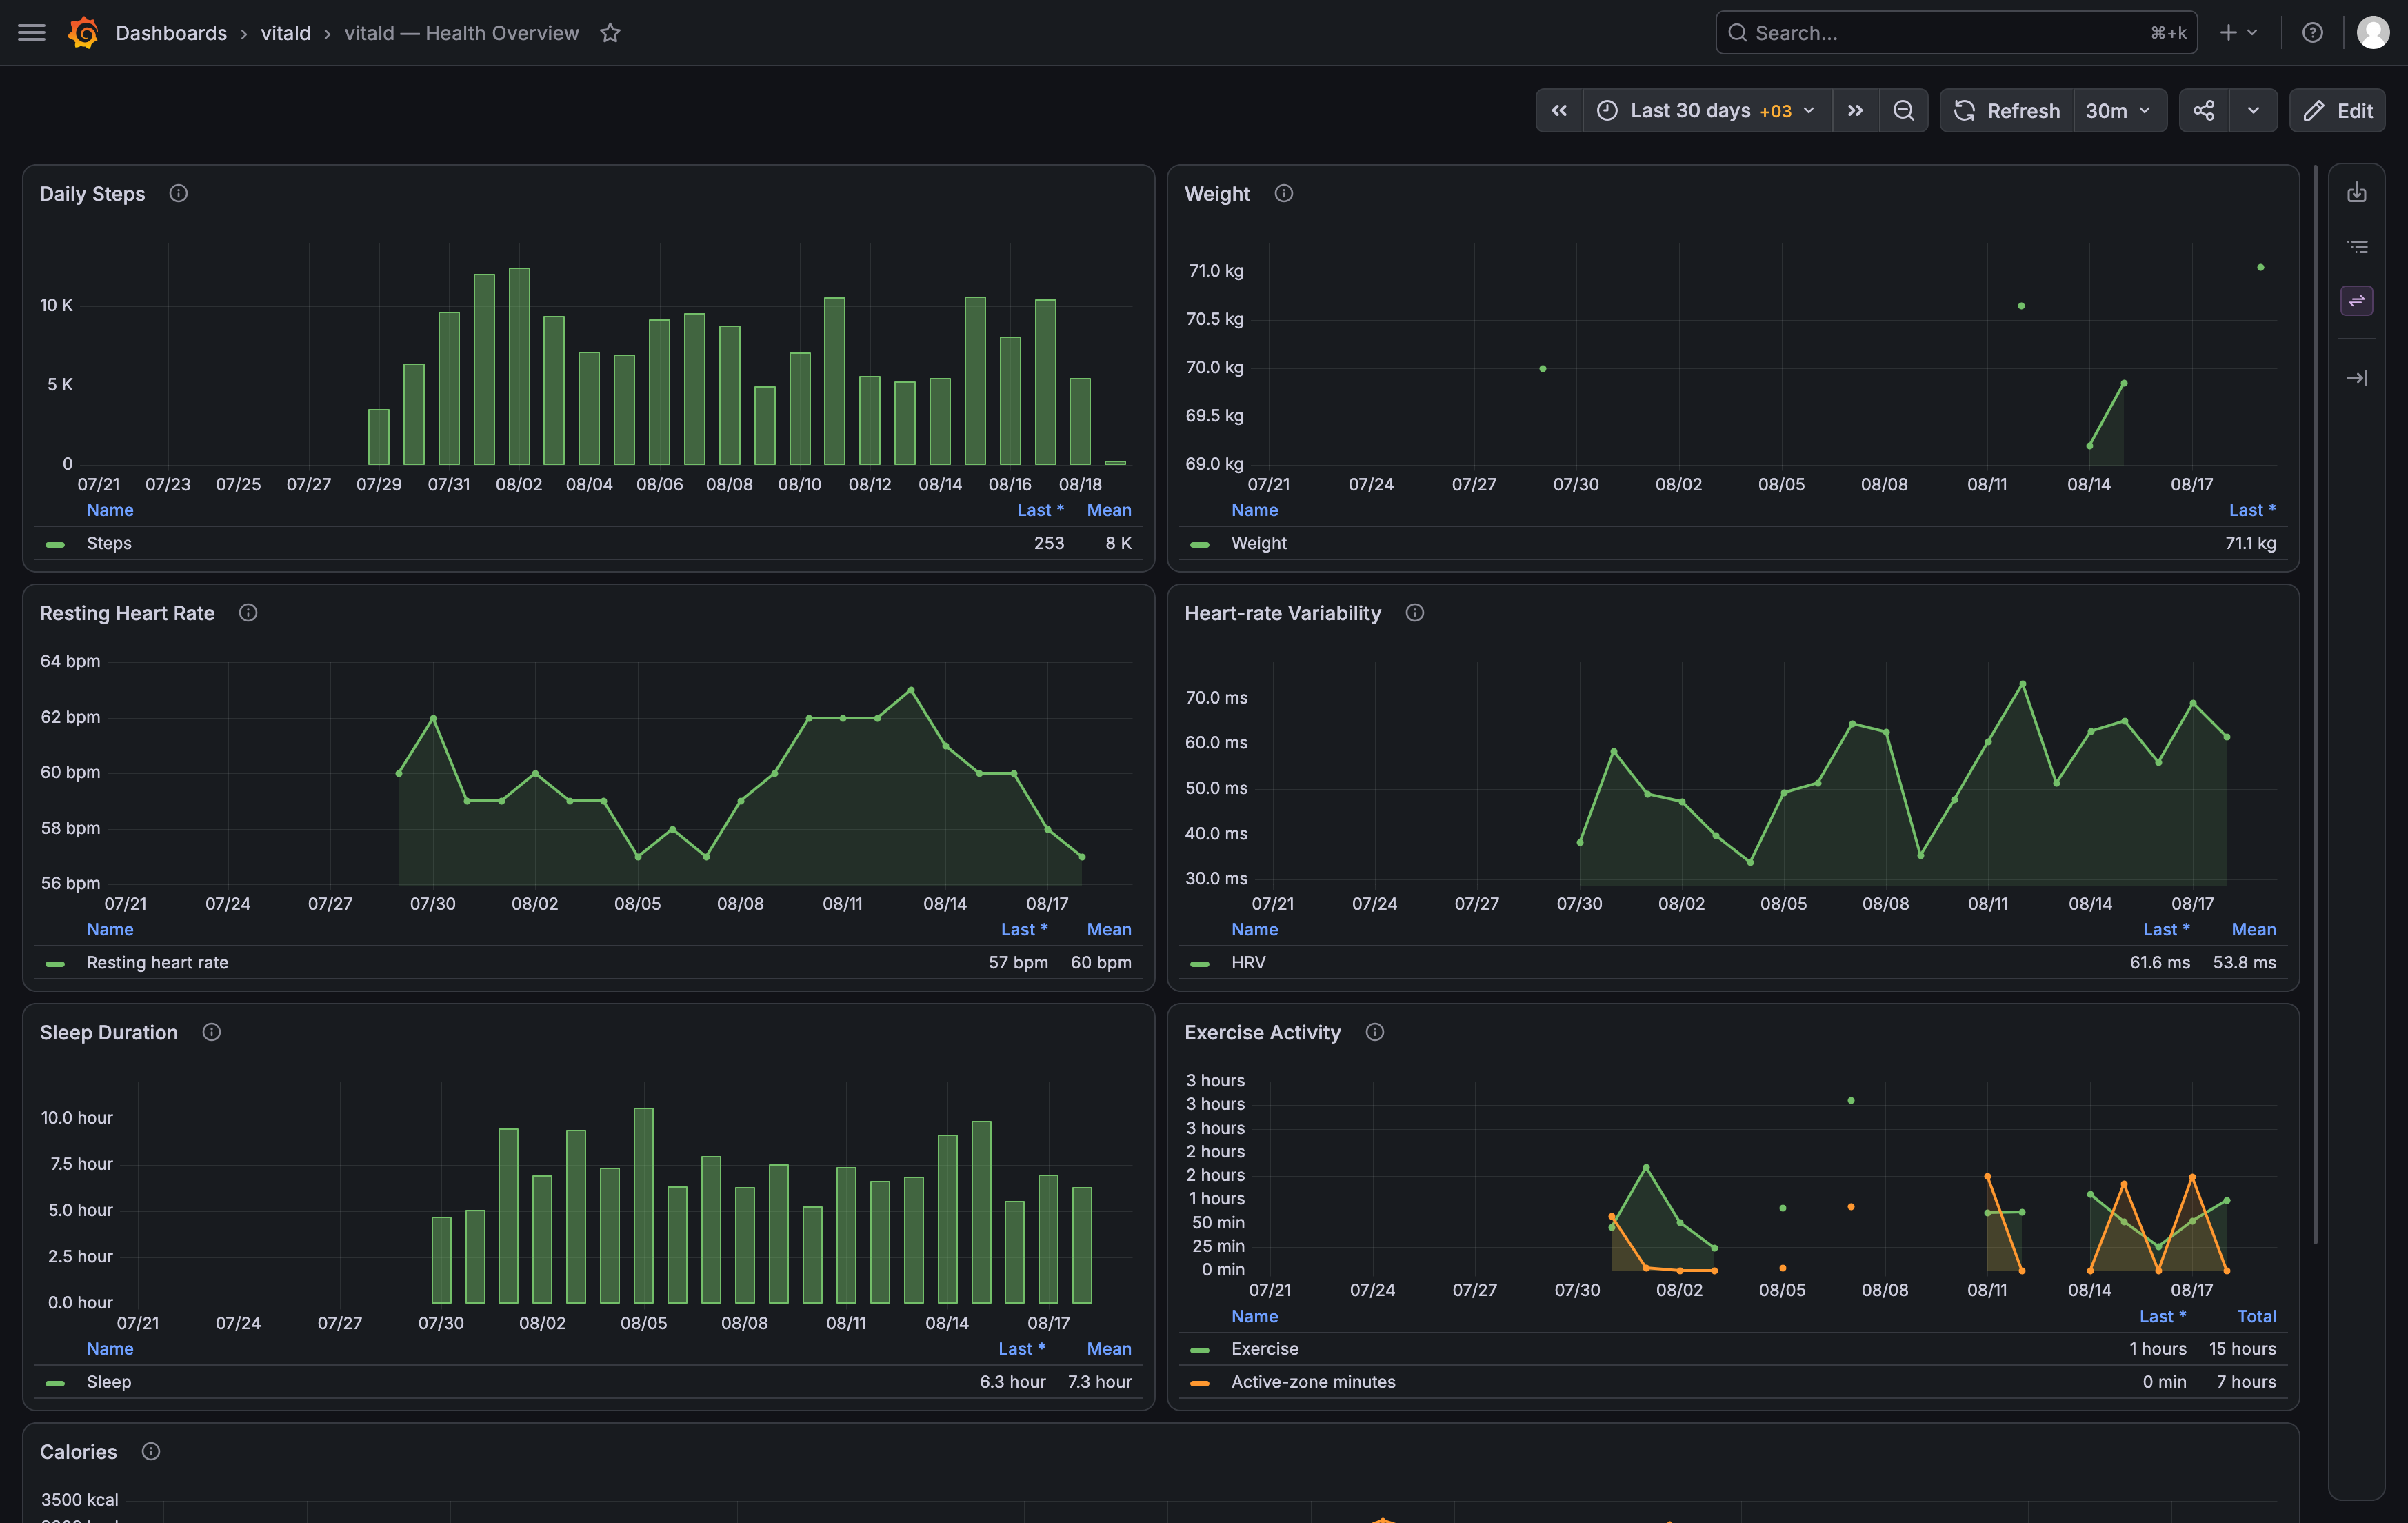
This overview dashboard contains:
- Daily steps count
- A plot of my recorded weight over time
- My resting heart rate (RHR) over time
- Heart rate variability over time
- Sleep duration every day
- Exercise data including total and active zone minutes
- Daily calories in and out
This contains the high-level data I would like to know in a quick skim. Then there are other dashboards and queries for data points I may find interesting to track to answer questions such as:
- How does my calorie surplus/deficit affect my weight over time? What’s my BMR?
- How does strenuous exercise affect my sleep duration?
- Is there any correlation between my sleep duration and weight?
- How did last year’s work stress affect my HRV and well-being?
This kind of information is not so trivially analyzed with the basic Google Health app, and definitely not available under Apple’s ecosystem since you don’t own your data there.
Architecture and data flow
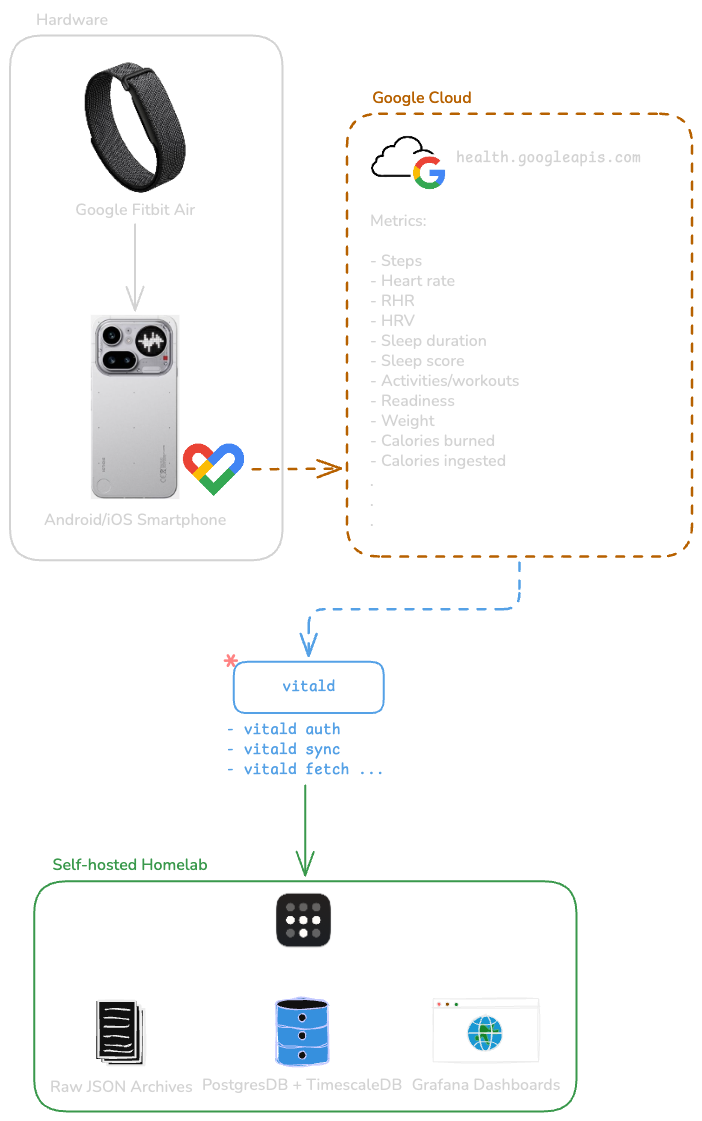
Below is the architecture diagram for the project’s data flow. The first two are straight forward and already provided by the hardware and Google’s infrastructure.
The vitald CLI and the components hosted locally on my
homelab are managed by this project.
The subsequent sections describe these 2 components in more detail.
Go utility
At its core, vitald is a Go command-line tool. It
handles the OAuth management with Google Cloud, and is responsible for
fetching, storing, and normalizing the data sets from the Health API
into JSON archives, as well as structured data in Postgres.
In a nutshell (note it is recommended to use docker/podman):
# First time authentication (sign-in and accept)
docker compose run --rm --no-deps --service-ports vitald auth

# Verify identity with Cloud project
docker compose run --rm --no-deps vitald identity

# Check on the status and last run(s) if any
docker compose run --rm --no-deps vitald status

# Initiate the first sync command
docker compose run --rm --no-deps vitald sync

# Health check
docker compose run --rm --no-deps vitald doctor
docker compose run --rm --no-deps vitald doctor --online # Check your auth
Compose and systemd
The project stack (Postgres, Grafana, vitald binary) are
bundled in compose.yaml, including backup and restore
services as well.
If you just want to run it once to try it out:
# Set up the project containers
docker compose up -d

# Then, for vitald, run the commands listed earlier
The scripts/install-systemd.sh script installs 4 service
unit/timer pairs for automated management, ideal for long-term usage and
homelab setups. Under the hood it uses the same compose commands.
After running this script you can verify the installed timers, as well as their previous and next scheduled runs:
systemctl --user list-timers "vitald-*"Sample output:
NEXT                            LEFT LAST                              PASSED UNIT                       ACTIVATES
Wed 2026-08-19 18:16:51 +03 1h 29min Wed 2026-08-19 12:16:52 +03 4h 30min ago vitald-sync.timer          vitald-sync.service
Thu 2026-08-20 02:01:53 +03       9h Wed 2026-08-19 02:01:56 +03      14h ago vitald-doctor.timer        vitald-doctor.service
Thu 2026-08-20 03:06:57 +03      10h Wed 2026-08-19 03:06:58 +03      13h ago vitald-backup.timer        vitald-backup.service
Sun 2026-08-23 04:01:53 +03   3 days Tue 2026-08-18 12:55:04 +03            - vitald-verify-backup.timer vitald-verify-backup.service
Steps to run it yourself
- Clone repo
git clone git@github.com:yousefakbar/vitald.git
cd vitald
Copy
.env.exampleto.envPopulate required variables in
.env- From Google Cloud Dashboard
GOOGLE_CLIENT_IDGOOGLE_CLIENT_SECRET
- Generate using
openssl rand -hex 32POSTGRES_PASSWORD(and update DATABASE_URL)GRAFANA_ADMIN_PASSWORDGRAFANA_SECRET_KEYVITALD_GRAFANA_DB_PASSWORD
- Generate using
openssl rand -base64 32.restic-passwordfile
- Specify the container engine in
$VITALD_CONTAINER_ENGINE- Defaults to
podman - You can switch it to
docker
- Defaults to
- Specify tailscale IP in
$GRAFANA_ROOT_URLto access externally
- From Google Cloud Dashboard
Source the
.envvariable to export their variables to your environment
set -a
source .env
set +a
Run
docker compose up -dfor image pulling and first time setupInitial
vitaldrun for auth and identity management
docker compose run --rm --no-deps --service-ports vitald auth
docker compose run --rm --no-deps vitald identity- Bring down compose project and then install the systemd units
docker compose down # (optional)
# "--engine docker" depends on if you use docker or podman (default)
./scripts/install-systemd.sh --engine docker
Google Cloud pre-requisites
Make sure you create a Google Cloud project from their dashboard and
get a Client_ID and Client_Secret to use in
the .env file.
Even more important is to make sure that it has the needed API permissions:
googlehealth.activity_and_fitness.readonlygooglehealth.health_metrics_and_measurements.readonlygooglehealth.sleep.readonlygooglehealth.nutrition.readonly
The auth and fetching will not work if you don’t have these permissions on the client generated.
Conclusion
In this day and age, data is your most valuable asset, so strive to own your data as much as possible.
By having access to your raw data, you can now take more intentional and informed decisions related to your health.
Just make sure not to obsess over it and remember to enjoy the moment!
With that said, although this is a personal project I made, I’d love to hear your thoughts and feedback. Anything related to either the technical implementation or, on a more creative side, the potential use cases for these dashboards are more than welcome.